.png?width=2338&height=1250&name=gold-2color-horizontal%20copy%20(3).png "X Agency Digital Marketing Agency Logo")
Return on Ad Spend (ROAS) is one of the most commonly cited marketing metrics. It’s simple, clear, and easy to understand: for every dollar invested in advertising, how much revenue did we generate?
But here’s the catch: ROAS only tells part of the story. A campaign can look strong on paper with a ROAS of 3.0, but still fail to improve profitability if acquisition costs rise, margins compress, or fixed costs absorb most of the gain. To truly measure marketing’s impact, we need to go beyond ROAS and trace its effect all the way to the profit and loss statement (P&L).
The Limits of ROAs
-
Revenue ≠ Profit. ROAS only reflects top-line revenue generated, not the costs required to deliver it.
-
Ignores Margins. A $100 sale with a 20% margin is worth less than a $100 sale with a 60% margin — but ROAS doesn’t tell you that.
-
Excludes Fixed Costs. Rent, payroll, and other operating expenses mean revenue gains don’t always flow through to the bottom line.
In short: ROAS shows efficiency, but not profitability.
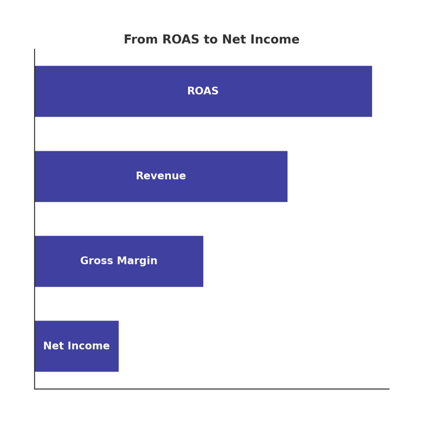
The Path to the P&L
To measure full financial impact, marketers must connect campaign performance to the structure of the income statement:-
- Revenue (Top Line): Campaigns generate incremental sales.
- Gross Margin: Those sales carry varying profitability depending on product mix and discounting.
- Operating Margin: Acquisition costs, overhead, and efficiency determine how much of gross profit is retained.
- Net Income (Bottom Line): The ultimate test — did marketing grow actual profits, not just revenue?
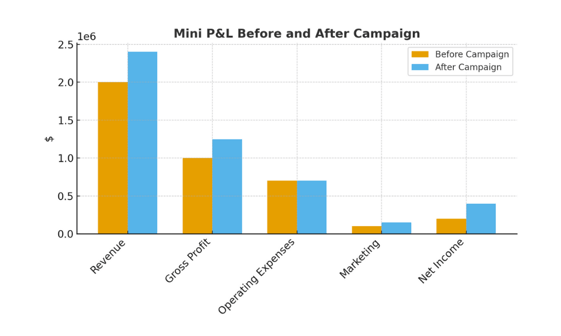
A Practical Example
Before Campaign
- Revenue: $2,000,000
- Gross Profit: $1,000,000 (50% margin)
- Operating Expenses (fixed): $700,000
- Marketing: $100,000
- Net Income: $200,000
After Campaign
- Revenue: $2,400,000 (+$400K)
- Gross Profit: $1,248,000 (52% margin)
- Operating Expenses (fixed): $700,000
- Marketing: $150,000
- Net Income: $398,000
Impact
- Incremental Revenue: +$400,000
- Incremental Gross Profit: +$248,000
- Incremental Net Income: +$198,000
- ROAS: 2.67 ($400K ÷ $150K)
- ROI: 132% ($198K ÷ $150K)
- Net Income Growth: +99% (from $200K → $398K)
This example illustrates how translating ROAS into net income impact tells a much richer story — one that CFOs and boards care about.
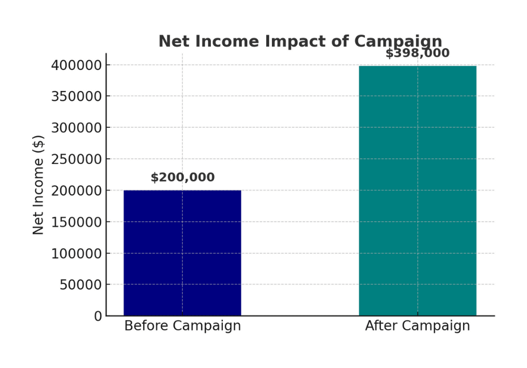
“Our $150K campaign generated $400K in revenue, lifted gross margin from 50% to 52%, and nearly doubled net income — a 132% ROI.”
Why This Matters
- Defensible Budgets: CFOs approve spend that clearly improves profitability.
- Better Decision-Making: Knowing margin impact ensures we scale campaigns that actually create enterprise value.
- Credibility in the Boardroom: When marketing is reported in financial terms, it shifts from “cost center” to “profit driver.”
From Efficiency to Profitability
ROAS is a great starting point, but it’s not the finish line. By measuring marketing’s full path through the P&L — from revenue to margin to net income — we can prove marketing isn’t just working efficiently, it’s working profitably.
The strongest marketing leaders aren’t just reporting on clicks and conversions. They’re showing how marketing grows revenue, protects margins, and expands profitability. That’s the story every CFO wants to hear.